

Here are presented the 5 most popular trading indicators. It is very succinct and just entered the indicators and above all explains when a buy and when a sell-signal is present.
Trading indicators
1. SMA (Simple-Moving-Average)
SMA is the simple moving average, as the English term implies. The SMA is relatively popular and easy to calculate. It is calculated by adding the average closing prices (closing prices are practically the last prices for a given period: hour, day, week etc.) of a certain time interval and then dividing by the time interval.
Here the interpretation is also quite simple:
- Prices above the moving average = bullish (buy-signal)
- Prices below the moving average = bearish (sell-signal)
2. EMA (Exponential-Moving-Average)
The EMA is a bit more complex than the SMA. The calculation is similar to the SMA. So the sum of the closing prices divided by the corresponding price bars, but here the younger courses are weighted more heavily than the older courses. This allows a faster response of the indicator to more up to date prices. In general, the interpretation of EMA is similar to SMA.
However, you can also represent the two in a chart and look at their course.
- If the EMA crosses the SMA from top to bottom, it is more of a sell-signal because the EMA reacts more strongly to the more recent prices
- a buy-signal may arise when the EMA crosses the SMA from bottom to top
3. MACD (Moving-Average-Convergence-Divergence)
MACD is probably one of the best-known indicators in a chart analysis. It is an indicator that represents the convergence of moving averages.
The blue line is the MACD line. This is determined by subtracting the exponential moving average of the last 26 days from the exponential moving average of the last 12 days. (By the way, these averages are also called EMA’s (“Exponential Moving Average”))
MACD = exp. MA (12) – exp. MA (26)
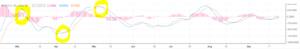
The red line is the 9th moving average. This line is also called the “signal line” because as soon as this line is touched by the MACD, it may suggest a buy or sell signal. If the EMA (9) is crossed from top to bottom by the MACD (thus the difference between EMA (12) and EMA (26)) this indicates a downtrend and is more of a bearish signal. This is exemplified in Figure 1. Marked in yellow, you can see intersections of the MACD with the 9th EMA. At the first marker, the blue line (MACD) intersects the red line (9th EMA) from top to bottom. => downtrend => sell-signal
If the MACD crosses the 9th EMA from below, this indicates an uptrend, which consequently leads to a buy signal (2nd marker in the figure).
Additional
These intersections and the associated buy or sell signals are the quintessence of traders.
However, for the sake of completeness, the following points are mentioned:
- A positive MACD speaks for a bullish mood (the opposite is true for the negative MACD)
- If the positive MACD continues to rise, it speaks for an increasingly bullish market environment (the negative continues to fall -> stronger bearish market environment)
- If the positive MACD falls, it speaks for a flattening uptrend (the opposite is true for the negative MACD)
- So you can say that with increasing distance of the MACD’s from the signal line the trend intensifies. If the distance becomes smaller, the trend becomes weaker. (Convergence / Divergence)
4. RSI (Relative Strength Index)
What does the RSI tell us? Put simply, the RSI tells us how good the value of each coin is in relation to its price. (Yes, price and value may be different. Price is what you pay for, value is what you get.) For simplicity’s sake, here’s no concrete calculation of the RSI, because much more important is the interpretation of it. As a trader, you never calculate the indicators, because there are software or programs such as TradingView. The interpretation is much more important.
The RSI value is between 0 and 100. There is a barrier so that a value between 0-30 is referred to as oversold, 30-70 says rather little and is considered more “normal”, and above 70 the value is called as overbought.
- sell-signal: when the RSI cuts the 70’s mark from top to bottom
- buy-signal: when the RSI rises from the 30’s range from bottom to top
- In addition: If the value of a cryptocurrency drops, while the RSI rises, it indicates a trend change
5. Bollinger Band
The exact calculations of this indicator will be omitted here. To put it simply, you can imagine this by plotting the SMA (20) in the chart and above that is the upper “Bollinger Band” and below the SMA (20) is another line, namely the lower “Bollinger Band”.
The quintessence for traders:
- If the price touches the upper band: sell-signal
- If the price touches the lower band: buy-signal